
 Vinay Karanam
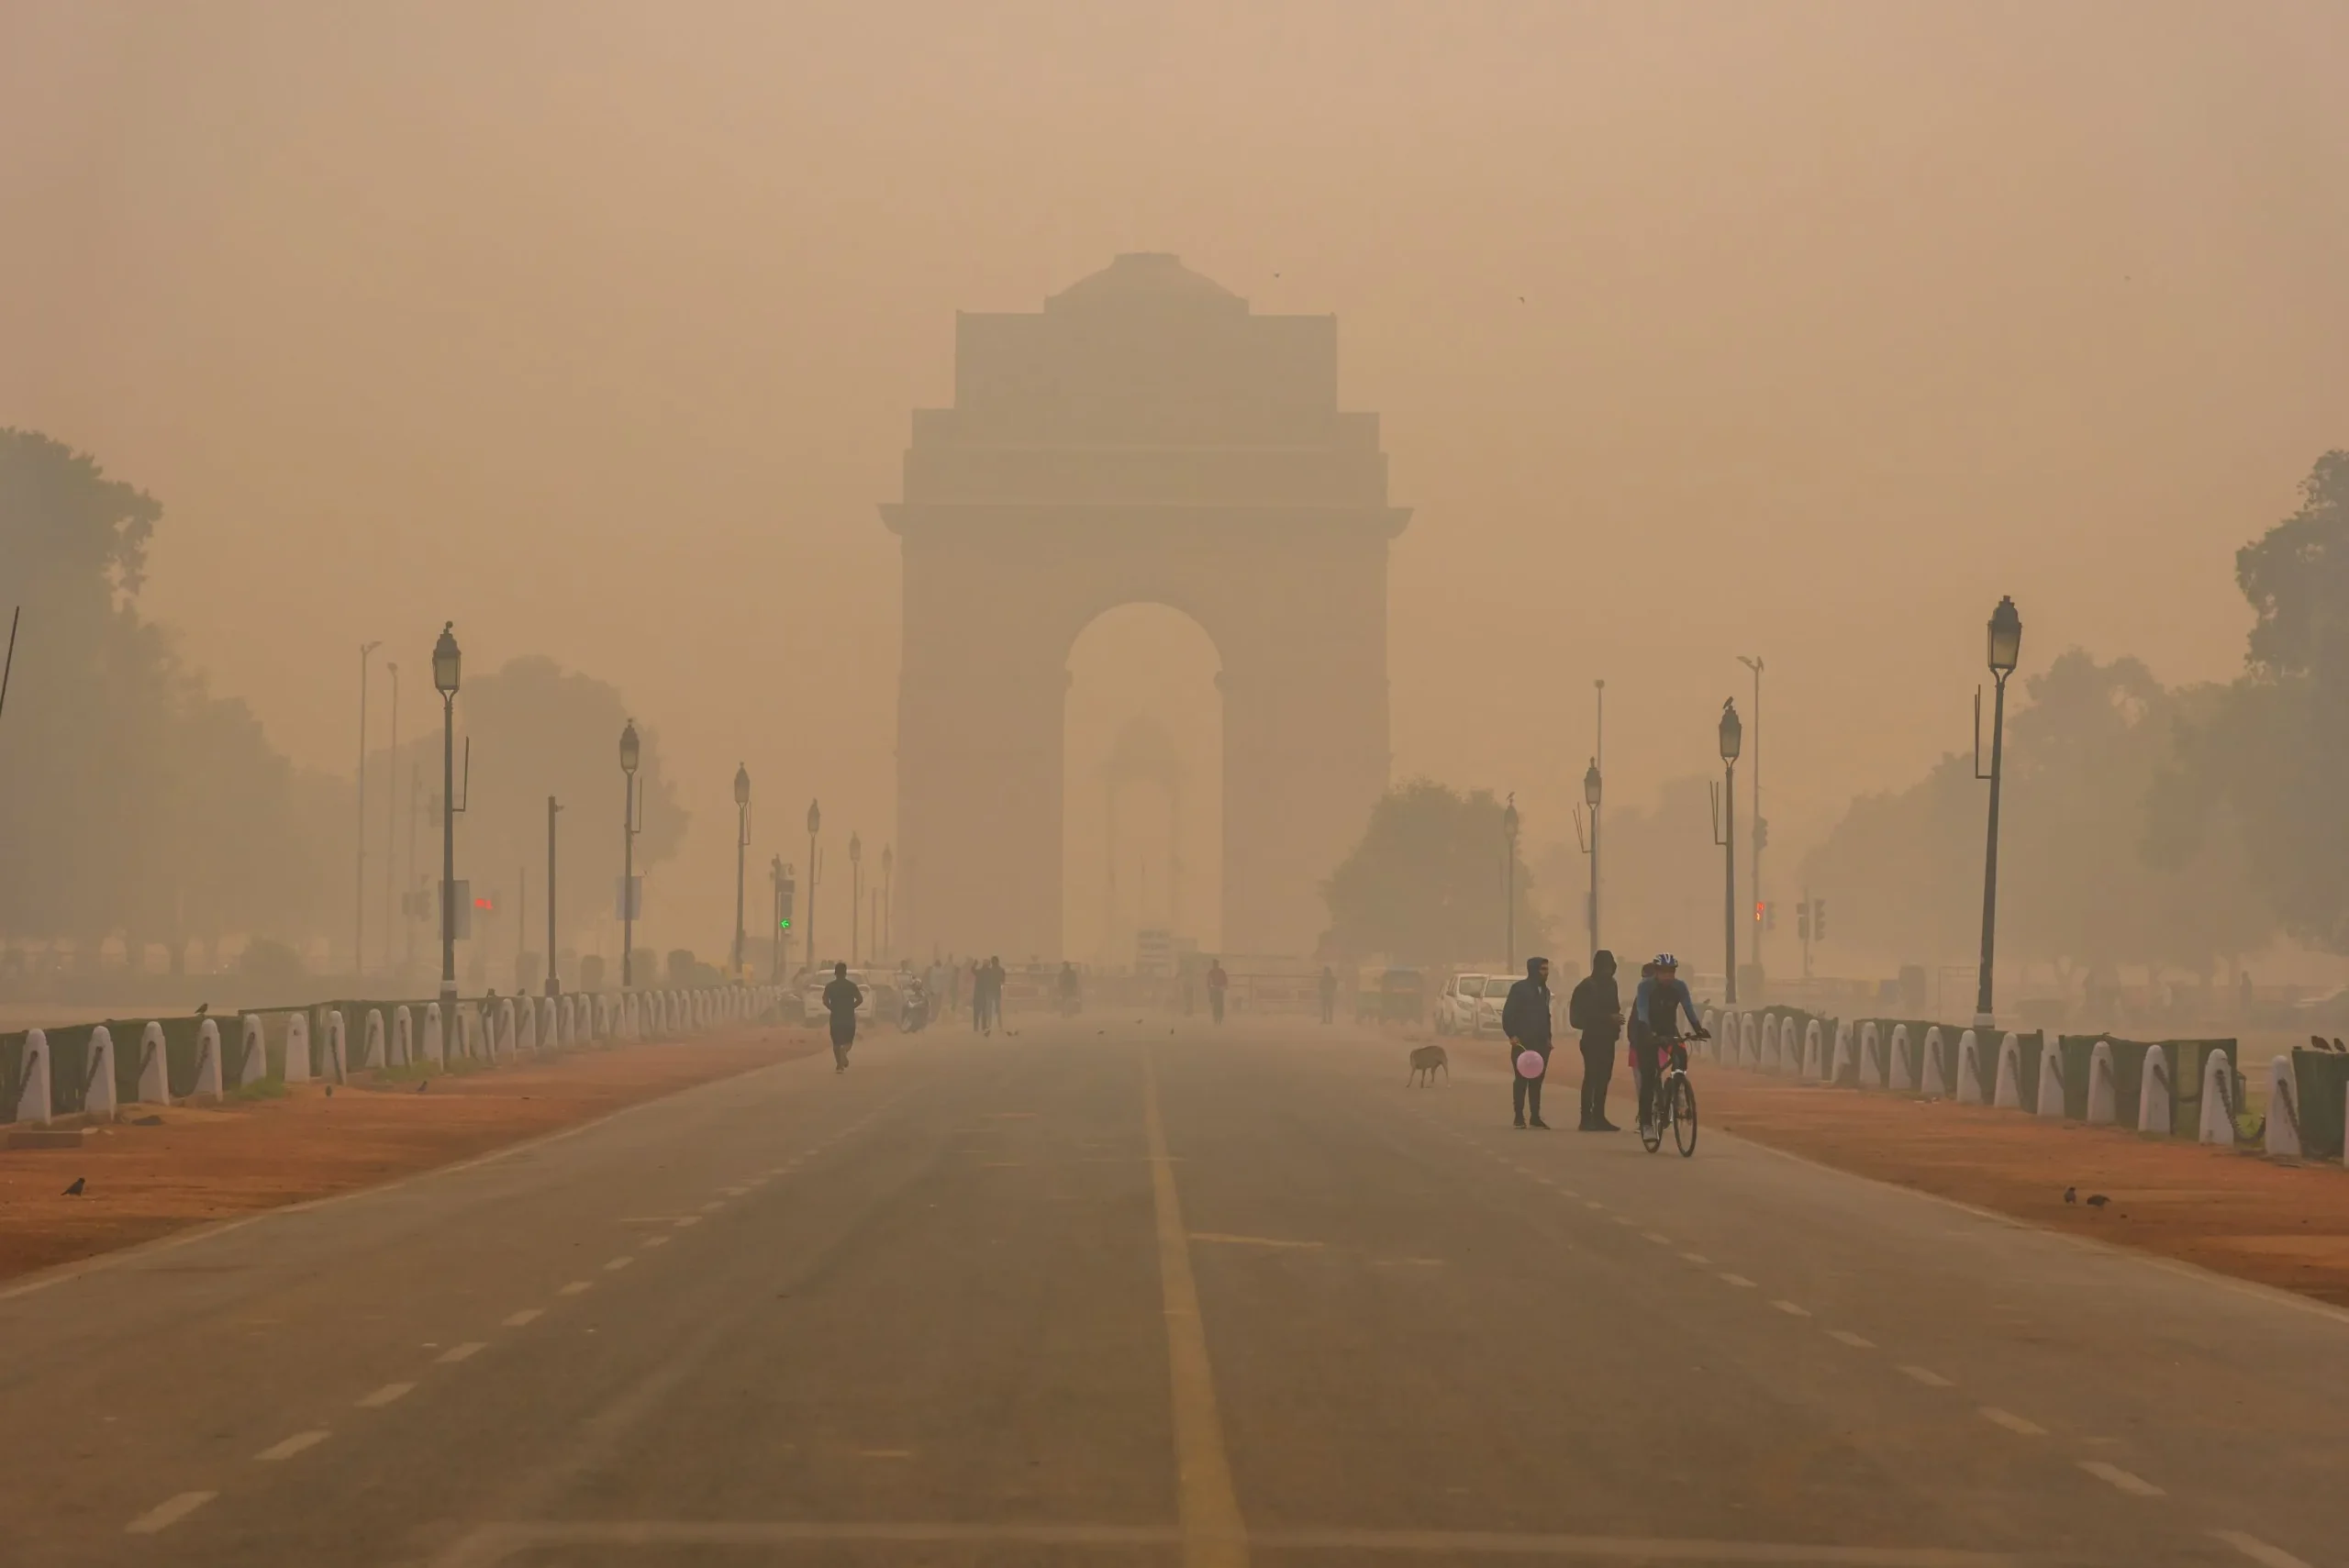
 Delhi’s air quality has been a growing concern over the past few decades. The city’s rapid industrialization, population growth, and increased vehicular emissions have significantly contributed to the deterioration of air quality. The problem has been exacerbated by seasonal factors such as stubble burning in neighboring states and temperature inversions during winter.
Current Situation
As of December 2024, Delhi’s air quality index (AQI) has reached hazardous levels, with PM2.5 concentrations far exceeding safe limits. The city recorded an unprecedented AQI of 795 in November 2024, marking the worst pollution episode in recent years. The main pollutants include particulate matter (PM2.5 and PM10), carbon monoxide (CO), sulfur dioxide (SO2), nitrogen dioxide (NO2), and ozone (O3).
Comparison with World Average
The World Health Organization (WHO) recommends an annual average PM2.5 concentration of 10 µg/m³. In contrast, Delhi’s annual average PM2.5 concentration has been around 150 µg/m³, which is 15 times higher than the WHO guideline.
Key Statistics
| Year | Highest AQI Recorded | Average PM2.5 (µg/m³) | WHO Guideline (µg/m³) |
|---|---|---|---|
| 2020 | 518 | 120 | 10 |
| 2021 | 700 | 140 | 10 |
| 2022 | 555 | 130 | 10 |
| 2023 | 528 | 125 | 10 |
| 2024 | 795 | 150 | 10 |
Pollution Sources
- Vehicular Emissions: Contribute approximately 40% to Delhi’s air pollution.
- Industrial Emissions: Contribute around 20-30%.
- Construction Dust: Accounts for about 20%.
- Stubble Burning: Contributes around 25% during peak seasons (October-November).
Health Impacts
- Respiratory Diseases: Increase in cases of asthma, bronchitis, and other respiratory ailments.
- Cardiovascular Diseases: Higher rates of heart attacks and strokes.
- Premature Deaths: Estimated thousands of premature deaths annually due to poor air quality.
Government Measures
- Odd-Even Scheme: Temporary traffic regulation to reduce vehicular emissions.
- Ban on Firecrackers: During Diwali to curb pollution spikes.
- Green War Room: Real-time monitoring and response to air pollution levels.
International Comparisons
| City | Annual Average PM2.5 (µg/m³) | WHO Guideline (µg/m³) |
|---|---|---|
| Delhi, India | 150 | 10 |
| Beijing, China | 50 | 10 |
| Los Angeles, USA | 12 | 10 |
| Tokyo, Japan | 15 | 10 |
| London, UK | 11 | 10 |
Long-term Solutions
- Public Transportation: Expansion and improvement of public transportation systems.
- Renewable Energy: Increase the use of renewable energy sources.
- Urban Planning: Implement green urban planning to reduce dust and emissions.
- Awareness Campaigns: Educate the public about the importance of reducing pollution.
Pollution Levels by Area (December 2024)
| Area | AQI | PM2.5 (µg/m³) | PM10 (µg/m³) |
|---|---|---|---|
| Anand Vihar | 443 | 259 | 368 |
| Wazirpur | 460 | 260 | 375 |
| Bawana | 476 | 265 | 385 |
| Ashok Vihar | 449 | 251 | 349 |
| Ghazipur | 472 | 262 | 378 |
Health Impact Statistics
- Respiratory Hospital Admissions: Increased by 30% during peak pollution months.
- Cardiovascular Cases: Increased by 25% during severe pollution episodes.
- Premature Deaths: Estimated 10,000+ annually due to air pollution-related diseases.
Government Measures and Their Impact
- Odd-Even Scheme: Reduced vehicular emissions by 10% during implementation.
- Ban on Firecrackers: Reduced pollution spikes by 15% during Diwali.
- Green War Room: Improved real-time response to pollution levels.
Weather Impact on Pollution
- Temperature Inversions: Trapped pollutants close to the ground, worsening air quality.
- Humidity Levels: High humidity levels (up to 95%) contributed to smog formation.
Monthly Average Pollutant Levels in Delhi (2024)
| Month | PM2.5 (µg/m³) | PM10 (µg/m³) | NO2 (µg/m³) | CO (mg/m³) | O3 (µg/m³) | SO2 (µg/m³) |
|---|---|---|---|---|---|---|
| January | 140 | 270 | 45 | 1.8 | 30 | 18 |
| February | 130 | 260 | 42 | 1.7 | 28 | 17 |
| March | 120 | 250 | 40 | 1.5 | 32 | 16 |
| April | 110 | 230 | 38 | 1.4 | 35 | 15 |
| May | 100 | 220 | 35 | 1.3 | 40 | 14 |
| June | 90 | 210 | 33 | 1.2 | 42 | 13 |
| July | 85 | 200 | 30 | 1.1 | 45 | 12 |
| August | 80 | 190 | 28 | 1.0 | 50 | 11 |
| September | 95 | 220 | 32 | 1.2 | 48 | 14 |
| October | 120 | 250 | 38 | 1.4 | 40 | 16 |
| November | 150 | 280 | 45 | 1.8 | 30 | 18 |
| December | 160 | 290 | 50 | 2.0 | 28 | 19 |
Comparison of Annual Average PM2.5 Levels (2024)
| City | PM2.5 (µg/m³) | WHO Guideline (µg/m³) |
|---|---|---|
| Delhi, India | 150 | 10 |
| Beijing, China | 50 | 10 |
| Los Angeles, USA | 12 | 10 |
| Tokyo, Japan | 15 | 10 |
| London, UK | 11 | 10 |
Health Impacts
The severe air pollution in Delhi has led to widespread health issues, including aggravated asthma, respiratory infections, and cardiovascular diseases. Hospitals have been overwhelmed with patients suffering from pollution-related ailments.
Government Response
The government has implemented various measures under the Graded Response Action Plan (GRAP) to tackle the air pollution crisis. However, these measures have often been criticized for being reactive rather than proactive. Stricter enforcement of regulations, better management of stubble burning, and improved public transportation are some of the long-term solutions suggested by experts.
Conclusion
Delhi’s air quality crisis is a complex issue that requires a multi-faceted approach to address effectively. While short-term measures can provide some relief, a comprehensive and sustained effort is needed to ensure cleaner air for the city’s residents.