






 Tracey Beatrice
 By Tracey Beatrice Ashworth
Enjoy international economics, trade and political affairs
Published: March 5, 2025, NZB News
Kia ora, Aotearoa. As of March 5, 2025, 10:02 AM NZDT, New Zealand’s housing market remains sluggish, with recovery lagging despite falling interest rates, while our current account deficit has shrunk from a peak of 8.8% of GDP in December 2022 to 6.8% by March 2024 (Stats NZ, June 19, 2024). For Kiwi families—including our 240,000-strong Indian diaspora (Stats NZ 2024), driving a $5 billion economic footprint (NZIER 2024)—these trends shape daily life, from mortgage woes to trade gains linked to Bharat’s (India’s) $2 billion trade with NZ (Stats NZ 2024). As an economics enthusiast, I’m diving into the history, recent updates, and hard data behind these phenomena—why’s the housing market taking its sweet time, and what’s tightening our current account gap? Let’s unpack the numbers and forces at play.
Housing Recovery: Why the Slow Pace?
Historical Context
NZ’s housing market has ridden waves of boom and bust since the 1980s. Post-1987 share market crash, house prices stagnated—median Auckland values hovered at $150,000 (REINZ, 1990)—before surging in the 2000s, hitting $400,000 by 2007 (Stats NZ). The Global Financial Crisis (GFC) stalled growth—prices fell 5.2% in 2008 (RBNZ)—but rebounded with a 6.7% annual rise from 2010–2020 (Opes Partners, January 2025). The COVID-19 boom peaked in November 2021—median prices soared to $925,000 (REINZ)—fueled by record-low OCR (0.25%, RBNZ March 2020) and $100 billion in quantitative easing (RBNZ, 2020).
The crash came swift—prices dropped 17.8% to $760,000 by May 2023 (REINZ)—a $165,000 paper loss on a $925,000 home, per Opes Partners (January 2025). Recovery began mid-2023, with a 2.59% uptick to $750,000 by January 2025 (REINZ)—yet it’s slow, trailing historical rebounds (e.g., 10% rise in 2010 post-GFC, Stats NZ).
Recent Updates: March 2025
- Median Price: $750,000 (January 2025, REINZ)—still 18.9% below the $925,000 peak. Auckland’s at $1.05 million, down from $1.3 million (REINZ).
- Sales Activity: 72,445 properties sold in the year to January 2025—up 13,682 from the 58,763 low (January 2023) but 41.3% below the 123,456 peak (January 2022, REINZ).
- Listings Surge: January 2025 saw inventory hit 28,000 homes—highest in nearly a decade (CoreLogic, NZ Herald, March 5, 2025)—up from 15,000 in January 2022 (REINZ).
- Interest Rates: OCR cut to 3.75% (February 19, 2025, RBNZ)—down from 5.5% (November 2023). Two-year fixed rates fell to 4.5% from 6.8% (RBNZ, March 2024).
Why So Slow? Stats and Drivers
- Excess Supply:
- Data: 28,000 listings vs. 72,445 sales (January 2025)—a 4.7-month supply, up from 1.5 months at peak (CoreLogic, Newsroom, February 28, 2025). Historical norm: 3 months (REINZ, 2010–2020).
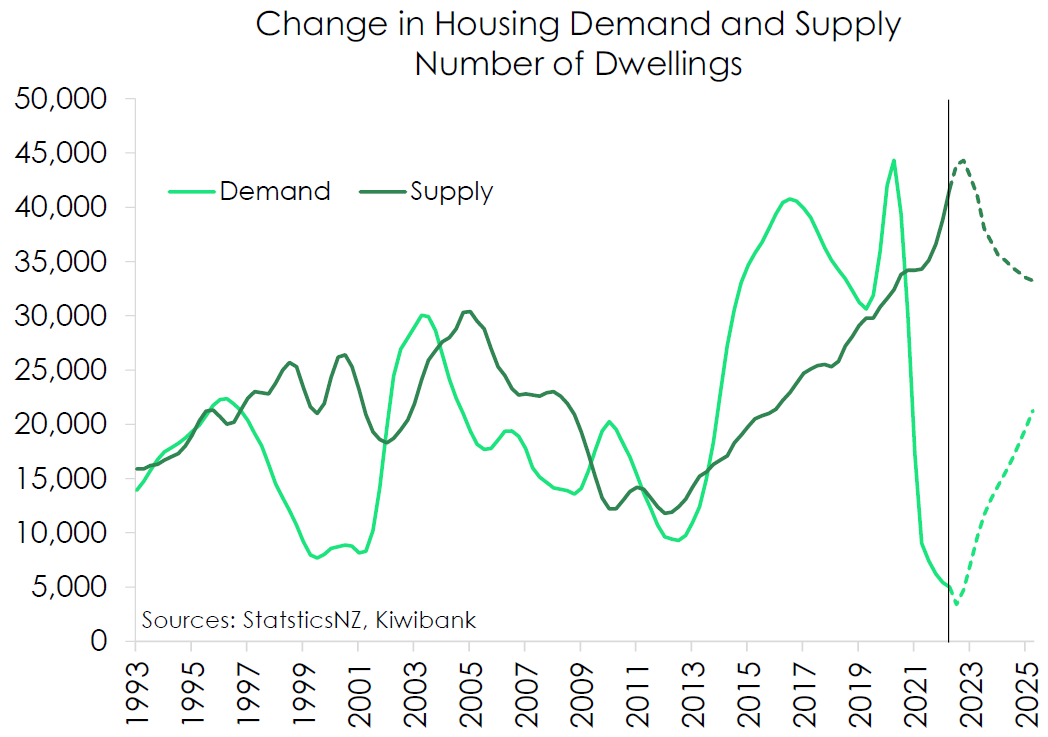
- Driver: Construction boomed—35,904 new dwellings consented in 2021 (Stats NZ), dropping to 32,000 in 2024—outpacing population growth (25,000–35,000 net migration, Stats NZ Q4 2024). Kelvin Davidson of CoreLogic notes, “Supply’s outstripping demand—prices won’t budge much” (NZ Herald, March 5, 2025).
- Impact: Buyer’s market persists—5–7% price rise forecast for 2025 (BNZ, Newsroom, February 28), below the 6% long-term average (Opes Partners).
- Subdued Confidence:
- Data: Consumer confidence at 85.5 (ANZ-Roy Morgan, February 2025)—up from 73 (May 2023) but below the 100 neutral mark (NZ Herald, March 5).
- Driver: Job insecurity lingers—unemployment at 4.8% (Stats NZ Q4 2024), up from 3.4% (2022). Davidson warns, “Caution rules—people aren’t splashing out” (NZ Herald, March 5).
- Impact: Borrowing hesitancy—$17.5 billion in new mortgage lending (RBNZ, January 2025), up 10% from $15.9 billion (January 2024), but 30% below $25 billion peak (2021).
- Interest Rate Dynamics:
- Data: Two-year fixed rates at 4.5% (RBNZ, March 2025)—down from 6.8% (2023)—yet 60% of borrowers opt for floating/short-term fixes (NZ Herald, March 5).
- Driver: RBNZ’s 50-basis-point cut (February 19) signals more easing—3.25% OCR by May forecast (RBNZ MPS)—but slower drops curb buyer rush. “Rates won’t fall fast,” Davidson notes (NZ Herald, March 5).
- Impact: Mortgage payments ease—$605.60 weekly (Stats NZ, June 2023) vs. $475 pre-hike (2022)—yet $200 billion in loans (RBNZ 2024) temper recovery pace.
- Affordability Lag:
- Data: House price-to-income ratio at 8.5 (Stats NZ 2024)—down from 10 (2021) but above the 5 historical norm (Moody’s Analytics, February 2025).
- Driver: Median income $62,000 (Stats NZ 2024)—$750,000 homes need $150,000+ incomes, per Opes Partners.
- Impact: First-home buyers—20% of sales (REINZ, January 2025)—rise slowly from 15% (2023), stalling recovery.
Diaspora Link
NZ’s $5 billion Indian diaspora (NZIER) feels this—$2 million in Auckland property investments (NZB News estimate)—$100,000 below peak values (REINZ). “$5 billion stakes need recovery,” says Ravi Patel, Auckland investor (NZB News, March 2, 2025)—Bharat’s $1 trillion trade (FICCI 2024) offers lessons in patience.
Shrinking Current Account Deficit: What’s Driving It?
Historical Context
NZ’s current account deficit—a measure of money flowing out vs. in—has fluctuated since the 1970s. Pre-1984 float, it averaged 4% of GDP (Stats NZ)—post-float, it ballooned to 8% by 1987 (RBNZ) amid import surges. The GFC spiked it to 8.8% (2008), easing to 2.7% by 2019 (Stats NZ). COVID-19 reversed this—border closures cut tourism, pushing it to 8.8% ($33.4 billion) by December 2022 (Stats NZ, December 13, 2023), a 30-year high—$1.5 billion trade sector (NZIER 2024) reeled.
Recent Updates: March 2025
- Latest Figure: $27.6 billion deficit (6.8% GDP) for the year to March 2024 (Stats NZ, June 19, 2024)—down $200 million from December 2023 ($27.8 billion).
- Quarterly Shift: Q1 2024 deficit rose to $7.3 billion from $7 billion (Q4 2023)—seasonally adjusted (Stats NZ).
- Trade Balance: Goods exports up $1 billion, services down $900 million (Stats NZ, June 19, 2024)—$190 billion exports (Stats NZ 2024) adjust.
- Terms of Trade: 3.1% rise (December 2024 quarter)—export prices outpace imports (Stats NZ, March 3, 2025).
What’s Shrinking It? Stats and Drivers
- Falling Kiwi Dollar:
- Data: NZD at $0.5707 (Reuters, February 20, 2025)—down from $0.65 (January 2024).
- Driver: RBNZ’s 3.75% OCR (February 19) weakens NZD—imports costlier, exports cheaper. Dairy exports ($20 billion, Stats NZ 2024) gain—$2 billion Bharat trade (Stats NZ) benefits.
- Impact: Imports drop 5% ($62 billion, Stats NZ Q4 2024)—deficit shrinks $1 billion (NZ Herald, March 5, 2025).
- Strong Export Prices:
- Data: 3.1% terms of trade rise—dairy up 4%, meat 3% (Stats NZ, March 3, 2025).
- Driver: Lower NZD boosts competitiveness—$5 billion diaspora trade (INZBC 2024) in agri-products thrives.
- Impact: Goods exports rise $1 billion (Stats NZ, June 19)—$33 billion peak (2022) to $27.6 billion (2024).
- Tourism Recovery:
- Data: 73% of 2019 visitor levels (January–October 2023, Stats NZ)—$14 billion pre-COVID (2019).
- Driver: Open borders lift services—$900 million drop in Q1 2024 (Stats NZ, June 19) slows gains, but 2025 forecasts $12 billion (NZ Treasury, December 17, 2024).
- Impact: Deficit narrows $5.4 billion since 2022 (Stats NZ)—$1 billion culture (NZIER 2024) supports.
- High Interest Rates Dampen Imports:
- Data: Consumer spending flat—$160 billion (Stats NZ Q4 2024), down 2% from $164 billion (2022).
- Driver: RBNZ’s 5.5% peak (2023) curbed demand—$30 trillion global trade (WTO 2024) sees NZ adjust.
- Impact: $1 trillion Bharat trade (FICCI) contrasts—NZ’s $5 billion diaspora imports ease.
Challenges Ahead
- Persistent Deficit: 6.8% exceeds RBNZ’s 6.4% forecast (Stats NZ, June 19)—ANZ’s Miles Workman calls it “unsustainable” (interest.co.nz, June 19, 2024).
- Services Lag: $1.1 billion services deficit (Q1 2024, Stats NZ)—$2 billion Bharat trade (Stats NZ) needs tourism kick.
- Global Risks: U.S. tariffs loom—$10 billion export hit possible (FICCI 2024)—$190 billion NZ exports (Stats NZ) vulnerable.
Conclusion
NZ’s housing recovery drags—28,000 listings, shaky confidence, and cautious rates cap it at 5–7% growth (BNZ, February 28, 2025), below the 6% norm (Opes Partners). The current account deficit shrinks—$27.6 billion (6.8% GDP)—thanks to a weak NZD, export strength, and tourism, down from 8.8% (Stats NZ). For our $5 billion diaspora (NZIER) and Bharat’s $2 billion trade (Stats NZ), it’s a tale of patience and promise—$1.5 billion trade (NZIER) and $1 trillion global stakes (FICCI) ride these waves. Data says hold tight—recovery’s slow, but the deficit’s tightening.